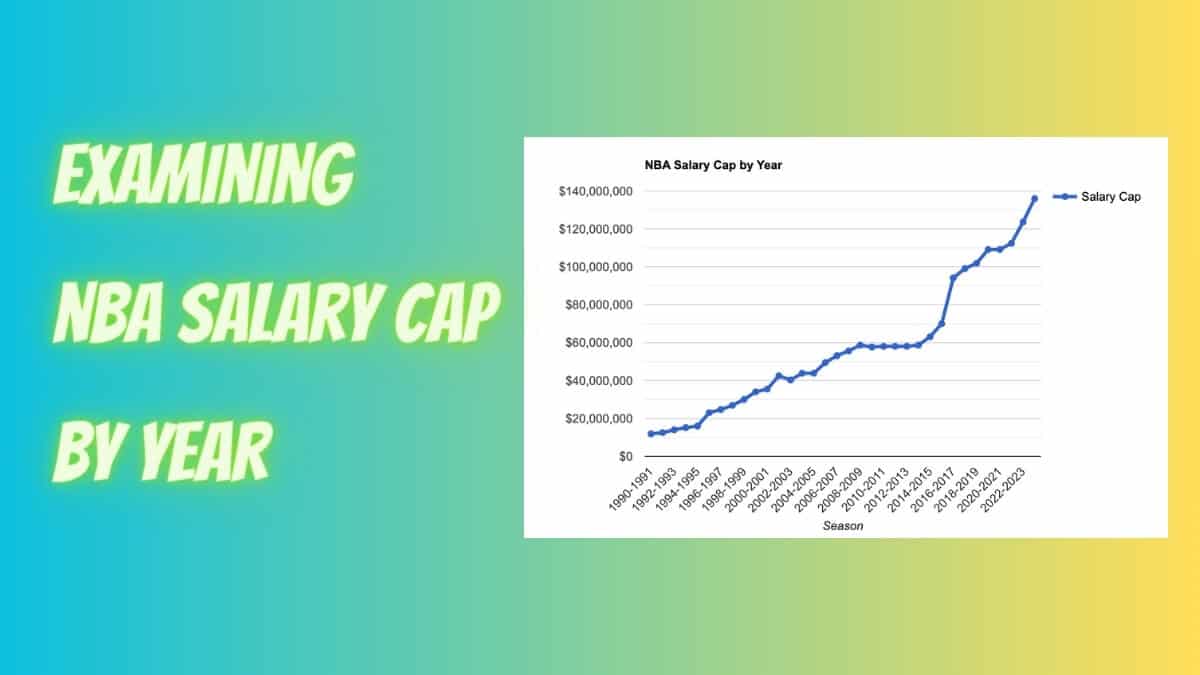
The NBA Salary Cap bares a major influence on how teams chose to develop their rosters, the overall salaries of NBA players, and just generally how the NBA operates. We’ve already explored NBA Payroll over time, but looking at NBA Salary Cap by year can reveal a lot about the development of the NBA.
So there are a few features here that stand out. Let’s zoom in…
The Growth of NBA Salary Cap
With 2 exceptions (2002-2003 and 2009-2010) the salary cap has increased every year since 1990. The biggest up-gap occurs into the 2016-2017 season.
Let’s see if we can tie these features to some real-world events.
What Caused the Salary Cap Dips in 2002 and 2009?
The 2002 dip was a result of a lower than expected media deal. The lion’s share of BRI, to which the salary cap is pinned, comes from media rights. When NBC let media rights slip to ESPN in 2002, the annual value of media rights income took a smaller than anticipated jump from around $650 Million to $766 Million.
The 2009 dip was pinned on the economic turmoil of the time. Projections leading into the 2009-2010 season called for a larger decline than would ultimately take place.
What Caused the Salary Cap Increase in 2016?
The 2016-2017 season was the first year of the media rights extension that saw annual income from broadcasting jump from around $930 Million per year to $2.7 Billion per year, marking the largest increase to BRI on record.
Takeaways
The data shows a wildly consistent linear growth in salary cap of around $3-$4 Million per year.
Cap growth appears to be taking off logarithmically. Logarithmic growth makes more sense, considering the nature of the NBA and financial models in general.
NBA Salary Cap is set in the NBA CBA as a percentage of Basketball Related Income (BRI). BRI is largely driven by media rights deals. The value of presenting basketball, a growing sport, in it’s most competitive form, is growing every year. And so the cap should grow by a similar percentage every year.
We’ll see how that goes in the future. With a major media rights deal on the horizon, it seems likely we’ll see another massive jump in Salary Cap in the near future. The NBA has yet to take advantage of the growth of streaming, and tapping into that new behavior could well drive new growth.
